Thursday, April 30, 2009

April 30, 2009

According to Mr. K the world has been visited by alliens! hahaaaaa =)

back to reality..

Today Mr. K started the class off by introducing us to a new program which he had on his calculator, it is called "TRISOLV2." Providing the program with atleast 3 bits of information, either angles or sides, the TRISOLV2 program can solve the entire triangle. Meaning the program solves the remaining unknown sides or angles.
He then gave us connecting cords for our graphing calculators and he sent the program to some of the students, from there we were to send the program throughout the rest of the class. Once we all had the program on our graphing calculators Mr. K continued on with the lesson.

He first reviewed adding vectors with the class, here is an example..

Find vector A+B

vector A is 6 km east
vector B is 10 km south
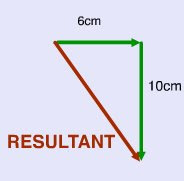
These vectors should look as shown below..
1 cm = 1 km
**Remember when using the triangle method the vectors are arranged tip-to-tail.**
The resultant of this vector addition would be the missing vector which connects all the vectors together by creating a triangle (3 sided figure)

1 cm = 1 km


Now to find the length of the resultant vector you can use pythagorean theorem. You can only use pythagorean theorem if one of the angles equals 90 degrees. In this case it does since the vectors go from east straight down to south.


The resultant vector equals 11.66 cm


Next Mr. K gave us another vector addition to solve, we were to use the triangle method aswell. But not just trying to find the length of the resultant vector, Mr. K also showed us how to solve for the angles of the triangle too. Here is the example that he used

Find vector A+B
vector A is 3 m east
vector B is 4 m north
1 cm = 1 m

These vectors should look like this..
The resultant vector is shown in the next image


Using pythagorean theorem as used in the example above, we find the length of the resultant vector as 5 cm.

Since the direction of the vector A goes east and vector B goes straight up to north, a 90 degree angle is created.

So the information that we are given all together would be side-angle-side (3cm-90 degrees-4cm)


Therefore, we must use the tri-function inverse TAN to find angle B


Now that we know that angle B equals 53.1 degress we are now able to use the TRISOLV2 program on our graphing calculator to determine the remaining unknown sides and angles of this triangle! All you have to do is open the TRISOLV2 program enter in the 2 sides and the angle into place as labled on the program. (What I mean is make sure that sides a b and c match whats on the diagram above and also the same goes for angles A B and C) Once you have entered in the known sides and angle press solve and the program should look a little somthing like this.
This tells us that angle A = 36.87 B = 53.13 and C = 90
also side a = 3 b = 4 c = 5
I have explained all that I understood and if you have any inputs please tell moi! =)
I CHOOSE KYLE TO SCRIBE NEXT =P

Today's Slides: April 30

Here they are ...


Wednesday, April 29, 2009

Well today wasn't the most productive day just because of the fire bell. But still we still did manage to get some work done. First we reviewed homework I myself learned a few new things for example.

The word COLLINEAR which when you break it down CO as in two and LINEAR meaning line

Here is an example of it


Vector AB is collinear to Vector BC, this works
because Vector AB is on the same line as BC.


Another thing I learned is that vectors must have an arrow above them when you write it or else it's not a vector just a line for example


And so forth, without the arrow it's just not a vector


So anyway besides homework review we also reviewed some trigonometry turns out we really need it in this unit. Some important ones included Pythagorean theorem , sin law and cosine law.

We then learned some useful properties of angles for example Opposite angles, and Alternate angles, Corresponding angles


So from what I gathered when two lines cross each ot
her they make 4 angles now if you label two angles say A and B it will look like this


Though i am not sure why we do this but Mr K told me that across from angle A will also be angle A and across from angle B will also be B sort of like this.


That's the rule for opposite angles


Now the next is Alt
ernate angles, now this to I also have trouble with so bear with me


Now from what I understand top left corner A
is equal lower right corner A and vice versa for B


So basically by knowing the alternate angle rules
the top right B angle is 120 degrees and the top left A angle is 60 degrees


And that is how you use the alternate angle rule

Lastly now were going to take a look at corresponding angles which looks like this


Kind of like alternative but your looking at what I guess is angles on the same side. For example this picture (B angles being on the same side and A angles on the same side)


So just like all the other rules each angles are completely the same what I mean by this is


If that is 110 degrees then that must mean the B angle is also 110 degrees and if that is 80 degrees then the A angle must be 80 degrees as well.


And this concludes my scribe sorry if it isn't informative as you all might have hoped it would be but I am still trying to get my head around this whole concept. The next scribe I choose is

IRIS
......

Today's Slides: April 29

Here they are ...


Monday, April 27, 2009

Vectors

Freshhh like uhh

So today we started with the new Unit on Vectors so far this is what i understood.

Vector - Distance, Magnitude
Scaler - Distance, Direction

Here are some examples

Examples:


My car weighs 2700 pounds. Scalar has no direction
I drive my car 50 000 km per year. Scalar has no particular direction
Brandon is 2044 km S of Winnipeg. Vector (magnitude = 2044km direction = S)
the wind is 50 kph from the south. Vector (magnitude = 50 kph direction = to the S)

4 Notations

  • An arrow indicates magnitude
  • tip indicates direction
  • Bearings angle is always measured clockwise from the N angle
  • always 3 digit number
  • Direction of Direction
  • Direction Degree Direction
Example


  • Bearing 360 - 30 = 330
  • 60 degress East of South
  • 30 degress South of East
  • E 30 degress S
  • S 60 degress E

Next Scribe is Henson

Today's Slides: April 27

Here they are ...


Thursday, April 23, 2009

Statistics Reflection

This unit on statistics was pretty challenging for me and I’m pretty sure that it was pretty challenging for the rest of the class. I think that I have quite a grasp at what each command does, like the inversenorm, normalcdf, binocdf etc. But I think that for me to fully understand this unit, I would need about an extra week or two more to fully understand it. From our last class I think that I was finally able to talk to my other group members to clarify what I had problems with, and that was VERY helpful for me. In about two hours our math test will take place, and hopefully everyone is prepared! Good luck to everyone!

Wednesday, April 22, 2009

REFLECTION!

Statistics, well what can I say about statistics. It was a pretty long unit and it was hard to get a grasp of everything. But I read over the slides and got some help from some of my fellow classmates. I started to understand what was being asked and which functions I needed to use and which bits and pieces of information that was missing. I understand the majority of the functions and which each does now, the only thing I'm not to sure on is making a histogram. Tomorrow is the test, Good luck to everyone :D

Statistics Reflection

Well here we are, at the end of another unit.


And as one might expect, the trip here wasn't easy. For example, I'm still not clear on how to create a histogram. I know I have to put the data in List One, I know I use Zoom Stat in the 2nd Trace menu, and I know I have to select the bar-ed graph from the stat plot menu, and put L1 in the top section and L2 in the bottom section. Unfortunately for me, I haven't a clue what goes in L2. Furthermore, it doesn't appear to be in any of the slides. or any of the scribe posts. I checked more than once. Damnit.

Also, I missed the class on Confidence Intervals and Margins of Error. Thankfully, the process by which they are found is simple enough. Confidence Interval is merely 1.96 Ïƒ above and below the mean. Easily expressed as (µ-1.96σ, µ+1.96σ). Likewise, Margin of Error is calculate by (1.96σ)÷(# of trials). For instance, if you had 100 trials with a standard deviation of 10 and a mean of 50, you'd have a confidence interval of (50-1.96(10), 50+1.96(10)), or (30.4, 69.6). The margin of error would be 19.6÷100, or 0.196. Also known as 19.6%

the problem I had with these concepts is the meaning of "Confidence" in this context. My assumption was that if the data was within the confidence interval, I could be confident in the probability of that occurrence. Not so. In fact, all it says is that, were I to repeat the experiment, 19 times out of 20 I'd be likely to find 95% of the data lying between the aforementioned interval. To reuse my previous example, 19 times out of twenty, 95% of the data of an experiment which (when previously tested) resulted in the data µ=50, #trials=100, and Ïƒ=10 would lie between 30.4 and 69.6.

Reflection on Statistics

There had been a lot of complications about this unit. Today, I finally understood what each command does. We did a lot of calculations and analyzed datas. It was pretty confusing at first. Especially for those who does not pay attention. I find binomial distribution easier than normal distribution. The invNorm command still confuses me sometimes. I'm not sure when to shade right or left. Besides that, I think I understand most of it.

Tomorrow will be our Unit Test. Good luck to everyone.

Statistics Reflection

I thought that this unit on statistics to be a little challenging but not that hard. I understood what I was doing during the class and I got how to solve the problems. I think that this unit is a little better for me than the probability unit. 

In this unit I had a little trouble on how to do the histogram and that was basically it. I knew how to do everything else. There is a lot of things that you have to remember on the calculator but i guess you just have to understand the problem to know which calculator function to use. I have been doing all my homework, which was helping me understand and how to do the problems more. 
Hopefully I do well on the test tomorrow! (: 
Good luck everyone! 

Reflection

I found kind of easy in studying about the statistics. As the topic started it is easy but when it is in the part of were binomial and normal use, it is kind of confusing but very interesting because i learned lots of term in mathematics. It is hard to know but as the subject goes on, it is easy to adapt on it. i find hard in the part were using formula like:

1-binomial(n,p,q) and other terms.

In addition to, I kind of confuse in at least, at most, less than and or more than.

Note: tomorrow is our test. (Thursday, 23th April).

Statistics Reflection

The Statistics Unit, was a hard but yet understandable unit. I was scared when I missed one class, which was yesterday, that I might of missed a lot of important things. But the day after that when I actually got to class in time, I understood what was given to us as a class. And I caught on quickly. The test might be a bit challenging for me as I do understand the unit, but I also get confused at times. I guess studying and looking into the problems deeper, and reviewing the slides that Mr. K puts up every night may help me. The unit was very hard for me to understand during the process of learning, but as we kept on solving problems, it came to me just like that. Hopefully I will do good on the test on Thursday!! Good luck to everyone!

Reflection


I found the statistics unit to be easier than the probability unit.
I didn't have any problems with the calculator commands. Ideas such as
Z-scores and finding the area between certain ones and what that represents I
found to be easy as well. The last part of the unit concerning the binomcdf and
binompdf functions I found to be a bit confusing at first. Also the confidence
interval I found confusing in the beginning as well. I am not as comfortable in
using those functions but hopefully I will do well on the test.

Today's Slides: April 22

Here they are ...


Reflection

Reflection

So this is my reflection on the unit of statistics, unfortunately i was away for a week during this unit but when i got back and learned things the same time as the rest of the class i understood.

The things i understood where things like:

  • the binomial and normal distribution,
  • how you calculate.
  • i also understand the mean median and mode good.

the things i didn't understand was:
  • the z-scores, how to get them and what they are and do.
  • how to get a histogram on your calculator and what it represents
  • inversnorm command
  • the standard deviation.
  • the shadenorm and normalcdf normalpdf are understandable but i am not completely confident in it and that is because i don't know which to use for what problem. usually my problems start because i don't know which formula to use for what problem...

over all this unit was good a little hard but hopefully i pass the test and carry on with my studies.

thanks.

Niwatori-san's Reflection (Statistics unit)

Ah well Statistics it wasn't entirely hard but not entirely easy... Just following the Concept of changing from a probability to an area was confusing if a person was to look and normal distribution. Anywho I'm fine with the details of the unit by now being some more practice should spruce up any minor areas where I don`t feel confident about where sources of error may occur at a high percentage if I don't be careful >_<

People for words of encouragement...

'' Pay yourself some worth rather something fancy ''

Tuesday, April 21, 2009

REFLECTION

Waaahh TEST on thursdayyy! Who's excited?
So, Mr. K has taught us everything we needed to know about Statistics. The only thing I learned was that Statistics is the hardest unit in Grade 12 Applied Math! hah! jk. In this unit we learned how to use normalcdf, normalpdf, binompdf, binomcdf, shadenorm, and invnorm. It was a bit confusing for me, I was having problems on which concept to use. I think the only key to pass the test is to study study study and being able to really understand the concept of normalcdf, normalpdf, binompdf, binomcdf, shadenorm and invnorm. that's all i can say. GOODLUCK everyone!

Statistics Reflection

The statistics unit is a rather very long unit. I found most of the things easy to under stand,but after we finished learning about the normal curve and how it is distributed, we learned about binomial distribution. Binomial distribution is what i found the hardest to understand and grasp. I do not think it was the concept that was hard, but how the problems are worded. The problems are worded with lots of "math words" that often confuse me. It has always been difficult for me to get the important info out of a math word problem, but other than that it pretty much all makes sense to me.
Ooh and another thing a little hard to me is remembering what calculation to use to find each missing piece of info. For example:_finding the mean, s.d., the z-scores and now the confidence interval are tough to remember....... This divided by this times that, that minus this over those,yadayada.

Today's Slides: April 21

Here they are ...


Monday, April 20, 2009

Today's Slides: April 20

Here they are ...


Saturday, April 18, 2009

Today's Notes

In today's note, we further our knowledge of Theoretical Binomial Distribution and learning how a mean is developed through Binomial Distribution. TBD is the method of estimating what the percentage of the outcomes would be before doing the experiment itself. On a graph, a TBD histogram would have a symmetrical look whilst the actual experiment has an assymmetrical look.

Example(s):


The method for finding the TBD that uses specific details is the same method as we have done in our Probability unit. Yet there is an easier way using our graphing caluclators. Through the use of the Binomial Probability Distrobution Function we could quickly identify the success chances for each and every outcome. To use it, go into your distribution menu and select binompdf. From there, input number of trials first, then the probability of success. If you wish, you could input an optional command and input the specific outcome, if you're only interested in one outcome. Though binompdf would not be the used if the problem asks for something more (or less).

Example(s):


In the case that it is not wise to use binompdf we would use binomcdf, or Binomial Cumulative Probability Distribution Function. To use it, binomcdf is right beneath binompdf. From there, it would be the same as we have done for binompdf. Except, that we add in the third value "- 1". We subtract 1 from the third option as it would add in an undesired value into the calculation. Binomcdf works similiarly like the invNorm function, so it would be wise to subtract from 1 sometimes.

Example(s):


In addition to all of this, we have learned how the Binomial Distribution affects the mean. Each time the number of trials are increased (or decreased), the mean will always hop to different number, albeit it that looks the same. Though with each additional trials, a histogram would start to look like a Normal Curve. By increasing or decreasing the probability of success, the mean would also hop to a different number, moving the histogram horizontally on the scale.

Examples(s):

An example of this would be in this website:
http://www.math.uah.edu/stat/applets/binomialcoinexperiment.xhtml

Done for today, next scribe is Amanda or Eugene.

Friday, April 17, 2009

Today's Slides: April 17

Here they are ...


Wednesday, April 15, 2009

PoP QuIz


Today we had a surprise quiz. After the surprise we got handed out a worksheet for homework. Everyone make sure you do it because tommorrow Mr.K will be calling people up to show how they did their answers on the board. I will do the first part of the first question with you incase some one is confused how to go about doing them still.


The Stanford-Binet IQ scores of Canadians are normally distributed with a mean of 100 and a standard deviation of 16. According to this test, what is the probability that a randomly selected Canadian will have the following IQs?


a) an IQ less than 100


First you have to find the z-score. Now remember to get the z-score you have to subtract the mean from the number your trying to find the z-score for. Then you divide by the standard deviation. So in this case it would look like...

99-100/16=-0.0625 . Why did i not use a 100 to subtract a 100? This is because the questions asks for a score less than a 100. After finding out the z-score you want to go to shadenorm here you would put in the area you want to find. In our problem here it would look like this...shadenorm(-5,-.0625). Then on your calculator you'd get an area which would be .475082 You then multiply by 100 to make it into a percent which turns out to be 47.5%


the next scribe is Jason

Tuesday, April 14, 2009

In today's class we started off by solving a problem together with our group about what we have been learning. After that we reviewed the TYPES OF DISTRIBUTION and learned about BINOMIAL DISTRIBUTION.

TYPES OF DISTRIBUTION
a.) UNIFORM DISTRIBUTION
: a distribution that has constant probability
: data may be discrete or continous.
*discrete data- can be represented by using only integers (eg number of people, number of cars, number or animals, etc...)
*continous data- can be represented using real numbers (eg height, weight, time etc...)
: Every outcome in the experiment is equally likely.
b.) NORMAL DISTRIBUTION
: data is contionous when certain experiments are carried out many, many times the probability graph of the data tend to be "bell-shaped" known as the NORMAL CURVE.
c.) BINOMIAL DISTRIBUTION
: one of the discrete probability distribution.

: It is used when there are exactly two mutually exclusive outcomes of a trial.
: These outcomes are appropriately labeled Success and Failure.

Here are the examples that we did in class...
How many girls are there in a family of four children


The experiment was done by flipping 4 coins (20 times). Each trial represented one family of four. The probabily for each outcome (0,1,2,3 girls...) was divided by 20 which is the total number of times the experiment was done for.


That's all we did for class today. Hope this helped some of y'all. :)

Amanda is the next scribe.

Today's Slides: April 14

Here they are ...


Monday, April 13, 2009

Statistics


Hi everyone, are today's lesson is about the disscussion of the assignments.


for example:


Find the probability of getting a z-score less than 0.90 in a standard normal distribution.


-as we can see, the normal distribution is equal to 1 and the middle or the mean is 0.50. Like in fraction, 0.75 is about three fourth (3/4) in normal standard curve and it is approximately between the mean and in 1 standard deviation.


-in solving the the probability of getting a z-score less than 0.90 is:
normalcdf(-5,0.90) is equal to o.8159 or 0.82.

-by using a calculator, you simply first:
*the home screen must be cleared and press 2nd.
*then, hit the VARS
*next is press 2 to move in normalcdf(
*after that it will back to home screen with normalcdf( , and just add like normalcdf(-5,0.90).

NOTE: you must always put an closing brackets after you put the numbers.


another example is:

What is the z-score if the probability of getting less than this z-scroe is 0.65?
-in solving this question, we will use invNorm, because the question ask is not about the area compare to the first one.

*first, press 2nd
*then,hit the VARS key again just like the procedure in using normalcdf(
*next is, press 3
*after that, put the numbers like invNorm(0.65) is equal to 0.3853 or 0.39.


the last question would be is:


What is our assignment today?


guys sorry for being kind of late in blogging our lecture today, I hope you will correct me if i have mistakes.

Today's Slides: April 13

Here they are ...


Wednesday, April 8, 2009

April 8th 2009

OK... so today we reviewed a few old concepts and started on some new ones.


FIRST things first...
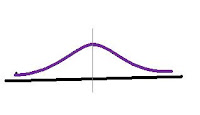

That, my friends, is the "normal" bell curve. The curve pretty much everything everywhere falls into. But what does it show us exactly?


Lets take a peek at how its devided up...
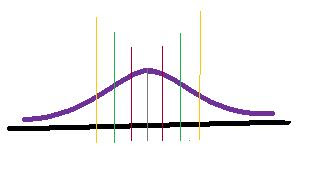

OK... so between the red lines lies 68% of all data.
between the Green lines lies 95% of all data.
between the
Yellow Lines lies 99.7% of all data.

Now what these sections show us is not JUST the % of data within each sections.
Between any two z-scores chosen along the axis of the curve we can find the are, the percentage AND a probability all in one.

On another point, remeber how befor we had to worry about window settings and clearing pictures ans so on jsut to find the ara between two z-scores? Well frett no more. Mr.K showed us the quick-fast way to do it. Get your calculators ready...

STEPS :
-ON
-2nd
-VARS
-2
You will then on your home screen see somthing that looks like "normalcdf( ". At this point, you type in your z-scores (lowest,highest) OR your range, mean then the standard deviation.. in that order , seperated by commas... like so (low end of the range,high end of the range, mean, standard deviation).
-Don't forget to CLOSE the bracket! )

Quick example of the FIRST way using the Z-scores.
Ex 1. Q. Given the Z scores -.2 and 1.4, what percentage of the data lies in that particular range?
A. normalcdf(-.2,1.4)
*hit enter*
The number you get is 0.4985
That number gives you three things.
-The area between those two numbers is .4985
-The percent of data within those two numbers (49.85%)
-The probability that of all the data collected, that something would be "picked" out of that specific section.
What the question asked for was percentage... so your answer would be 49.85%

Next example of the OTHER way by using the range, mean and standard deviation.
Ex 2. Q. A selection of numbers has been aquired. Given a high of 190 and a low of 160, a mean of 150 and a standard deviation of 10, what is the probability that a selected number from a particular group of numbers is within that range?
A. normalcdf(160,190,150,10)
*hit enter*
You get 0.1586

Final thing we used was the Reverse norm function. It is a function we have that allows us to find the z score using the area.
STEPS:
-ON
-2nd
-VARS
-3
At this point you enter in the area/persentage/prabability.

Well that about summs it up. Gnight.
Next scribe is Eugene.
Today's Slides: April 8

Here they are ...


Tuesday, April 7, 2009

April 07/09 scrib

Hey guys sorry for the late post my relative had gone in to the hospital, so i only got home at 11... Also please bare with me on today's class's scribe because i am not understanding the work very well and am still learning. so anything i have posting that is incorrect please leave a comment so i can correct it which possibly some help

Today we worked with Z-scores and the normal curve

Before we got into it MR.k had given us a Littlee quiz on determining the length of arrowheads one standard deviation below and one above the mean of numbers. Also on knowing what percentage of arrowheads are within one standard deviation of one mean length.

We then corrected the quiz and handed it back

Next we talked about curving marks..


The graph above represents the marks of a large number of students with the mean mark of 69.3% and stranded deviation of 7

so this shows that the students with the marks of 62.3 to 76.3 are the mean marks of the class and are about 68-69 percent are in that mean. as the others shows above.

So knowing this then

68% of the marks are between 62.3-76.3 percent
34 percent are between 69.3 and 76.3 percent
50% are below 69.3%
and 16% are above

So since we have been doing non standerd deviations till this point which means the mean and standard deviation of the distribution or problem have been the standard deviation and mean of the data. now we will try a


standard normal deviation

scale on the x-axis on the window of your calculation is the Z-score(standard score) which is the mean. and standard deviation is 1 so since it is a probability distribution the area under the curve=1
which means it is 100% chance of every score being included in this problem(distribution)


To figure this out on the calculator you press

WINDOW
(then add your y and x numbers along with the xscl etc..)

QUIT

2nd VARS(dist)
(then move to the right to draw)

then press number 1 which is shadenorm

then in the open bracket put in the standard deviation and mean i think

close bracket

ENTER

your graph should be shown..

that's about all we did in class again if anything is in correct please leave a comment and help me correct it because i am unsure of my knowledge of this unit.

I'm trying and hoping to succeed

next scribe is...KATIE


Today's Slides: April 7

Here they are ...


Monday, April 6, 2009

Today's Notes

In today's notes, we learn of two ways on how a normal distribution curve is formed. Using the mean and the standard deviation (in other words, z-score) we can form what shape it is. The mean, is the indicator to where the curve is position on a horizontal plane, whilst the standard diviation is indicates how steep the curve is. Depending on the standard diviation, the curve can either become very narrow or very wide. You can determine whether the standard deviation is smaller or larger by the curve's shape. If the curve is narrow, the standard diviation is small, and vice versa when the curve is wide.

We've also have learned of how to interpret a Z-Score. By multiplying the score with the Standard Deviation then adding it with the mean, we reveal the value of the Z-Score itself.

The next Scribe will be either Melissa or Chelsea.

Example(s):
1)


2)
-1 (2) + 6 = 4

Today's Slides: April 6

Here they are ...


Developing Expert Voices: The Assignment


The Assignment
Think back on all the things you have learned so far this semester and create (not copy) four problems that are representative of what you have learned. Provide annotated solutions to the problems; they should be annotated well enough for an interested learner to understand and learn from you. Your problems should demonstrate the upper limit of your understanding of the concepts. (I expect more complex problems from a student with a sophisticated understanding than from a student with just a basic grasp of concepts.) You must also include a brief summary reflection (250 words max) on this process and also a comment on what you have learned so far.

If you wish you may work in groups of two or three students but not more. A group of two students is required to create five problems; a group of three, six problems.

Timeline
You will choose your own due date based on your personal schedule and working habits. The absolute final deadline is June 7, 2009. You shouldn't really choose this date. On the sidebar of the blog is our class Google Calendar. You will choose your deadline and we will add it to the calendar in class. Once the deadline is chosen it is final. You may make it earlier but not later.

Format
Your work must be published as an online presentation. You may do so in any format that you wish using any digital tool(s) that you wish. It may be as simple as an extended scribe post, it may be a video uploaded to YouTube or Google Video, it may be a SlideShare or BubbleShare presentation or even a podcast. The sky is the limit with this. You can find a list of free online tools you can use here. Feel free to mix and match the tools to create something original if you like.

Summary
So, when you are done your presentation should contain:
(a) 4 (or 5, or 6) problems you created. Concepts included should span the content of at least two full units. The idea is for this to be a mathematical sampler of your expertise in mathematics.

(b) Each problem must include a solution with a detailed annotation. The annotation should be written so that an interested learner can learn from you. This is where you take on the role of teacher.

(c) At the end write a brief reflection that includes comments on:

• Why did you choose the concepts you did to create your problem set?
• How do these problems provide an overview of your best mathematical understanding of what you have learned so far?
• Did you learn anything from this assignment? Was it educationally valuable to you? (Be honest with this. If you got nothing out of this assignment then say that, but be specific about what you didn't like and offer a suggestion to improve it in the future.)

Experts always look back at where they have been to improve in the future.

(d) Your presentation must be published online in any format of your choosing on the Developing Expert Voices (2008) blog.
Experts are recognized not just for what they know but for how they demonstrate their expertise in a public forum.

Levels of Achievement
Instead of levels 1-4 (lowest to highest) we will use these descriptors. They better describe what this project is all about.

Novice: A person who is new to the circumstances, work, etc., in which he or she is placed.

Apprentice: To work for an expert to learn a skill or trade.

Journeyperson: Any experienced, competent but routine worker or performer.

Expert: Possessing special skill or knowledge; trained by practice; skillful and skilled.

Template by - Abdul Munir | Daya Earth Blogger Template